![]()
![]()
![]()


Table of Contents
GCP Case Study
Read the Google Cloud blog post: “Quest for a better investment platform leads to Google Containers, BigQuery and Sheets”
Presentation Download
- SenTai Canaccord Quest Migration – EN (Google Slides)
- SenTai Canaccord Quest Migration – EN (ppt)
- SenTai Canaccord Quest Migration – EN (pdf)
- SenTai Canaccord Quest Migration – FR (Google Slides)
- SenTai Canaccord Quest Migration – FR (ppt)
- SenTai Canaccord Quest Migration – FR (pdf)
Introduction
Quest® is a B2B Business Intelligence financial web application, owned and run by Canaccord Genuity Ltd. It is a proprietary analytical research system utilising historical financial accounting data and consensus forecast data. Its end users are typically asset managers, using it as an equity analysis and valuation tool, for information and decision making purposes.
Web
Invalid Displayed Gallery
Story
Quest®, originally built by Collins Stewart, has existed for nearly 20 years, and has evolved through many cycles of development and redevelopment. Since inception, it has been run and hosted in-house, based on Microsoft Server Technology (ASP.net). Like most financial applications, it is driven by the ways in which the processed data is made accessible to end users. This can be in the form of a website (primary use), via Google Sheets and centralized Google scripts (using REST APIs and a Google Managed Library), or via a Web Admin Interface for Canaccord Internal users. Like most financial web apps, it was hosted in-house, requiring costly and time consuming backup, maintenance, and support. The complex multiple stage-based model required a complex architecture and infrastructure which became very difficult to maintain, and reached a hard impasse in terms of scalability.
Architecture & Technique
Architecture & Scalability
The application was no longer scalable, in terms of overnight processing capacity or storage. Thus both the model and the application were too complicated to maintain. It had to be rewritten from scratch to allow for a much larger pool of companies to be processed during nightly computations. Moving from on-premise hosting to cloud based hosting was a necessity to allow for peak scaling of both the computational, memory, and storage capacity.
Computational Challenge
The difficulty lay in rethinking the architecture of the software to mimic the tree-like calculation of the Quest® valuation model within a few hours. This data intensive task requires the reading of millions of files, more than 30+ billions data values and the production of a vast number of multi-dimensional (tensor-like) metrics, per company, per industry, and per geographical region. Furthermore, intra-day recalculations have to be enabled, per company, or per geographical region. This can take place following a correction to the Model via formula alteration, or Data re-import. The computational challenge is therefore intertwined with the agility and ease of use of the entire platform.
Static vs Dynamic Valuation Model & Java transformation
A full reverse engineering analysis was performed on the static legacy model, and adapted to a tree-like valuation model consisting of several thousand formulas, 80+ levels deep of a large dependency tree, and a similar structure for aggregate (regional and industrial) type calculations. Altogether more than 200+ stages are sequentially executed, performing 7000+ rules, using non trivial mathematical / numerical procedures, and complex business rules.
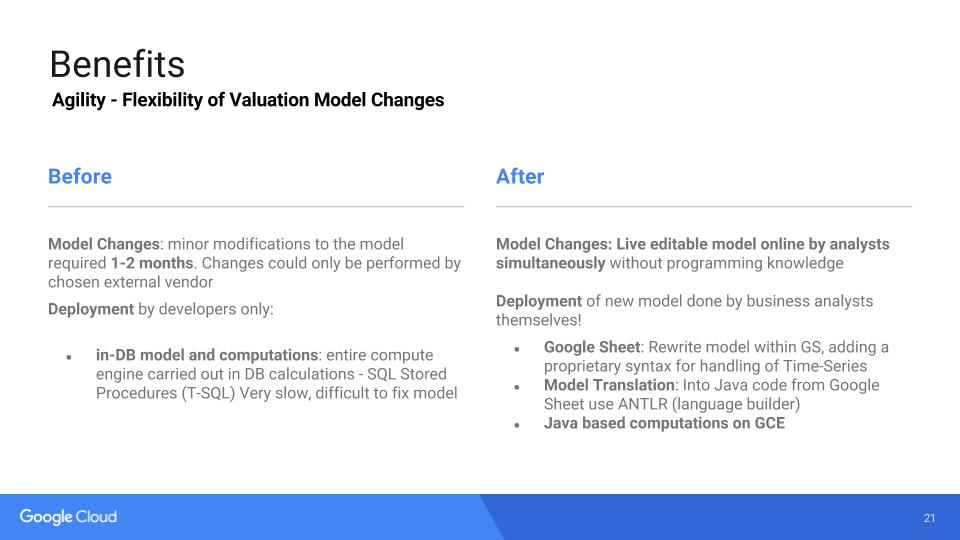
Having a clean tree-like model was a first step, the second challenge was to allow Business Analysts to modify the model (add/modify/remove formulas) without any help from IT or developers. With the legacy application, a minor model modification involved a minimum of 3 weeks process.
This tour-de-force was accomplished thanks to Google Sheets, where Business Analysts can define all their formulas. This tool has 2 main advantages for Business Analysts:
- they can work collaboratively (simultaneously) with appropriate permissioning.
- they are pretty familiar with this kind of tool
The other obvious main advantage was to use Google Sheets as a ready-made GUI to manage these formulas.
Formulas are written in a specialized language (google sheet syntax or excel-like syntax) that is formally defined by a grammar. The Google Sheet neither interprets any formula, nor does it calculate anything. It works as a living documentation.
The Valuation Engine (where the Quest valuation model resides) reads this spreadsheet, performs thorough validation checks, to detect and report cycles for example, and transforms each formula into Java code. This last operation is done thanks to the Antlr framework (language parser generator). Java code execution greatly speeds up the entire calculation (“Full VE Run”).
At a higher level, business analysts can configure which model (spreadsheet) the VE should use. This enables them to experiment with new models and manage themselves the model life cycle, independently of the VE life cycle.
App Production Cycle
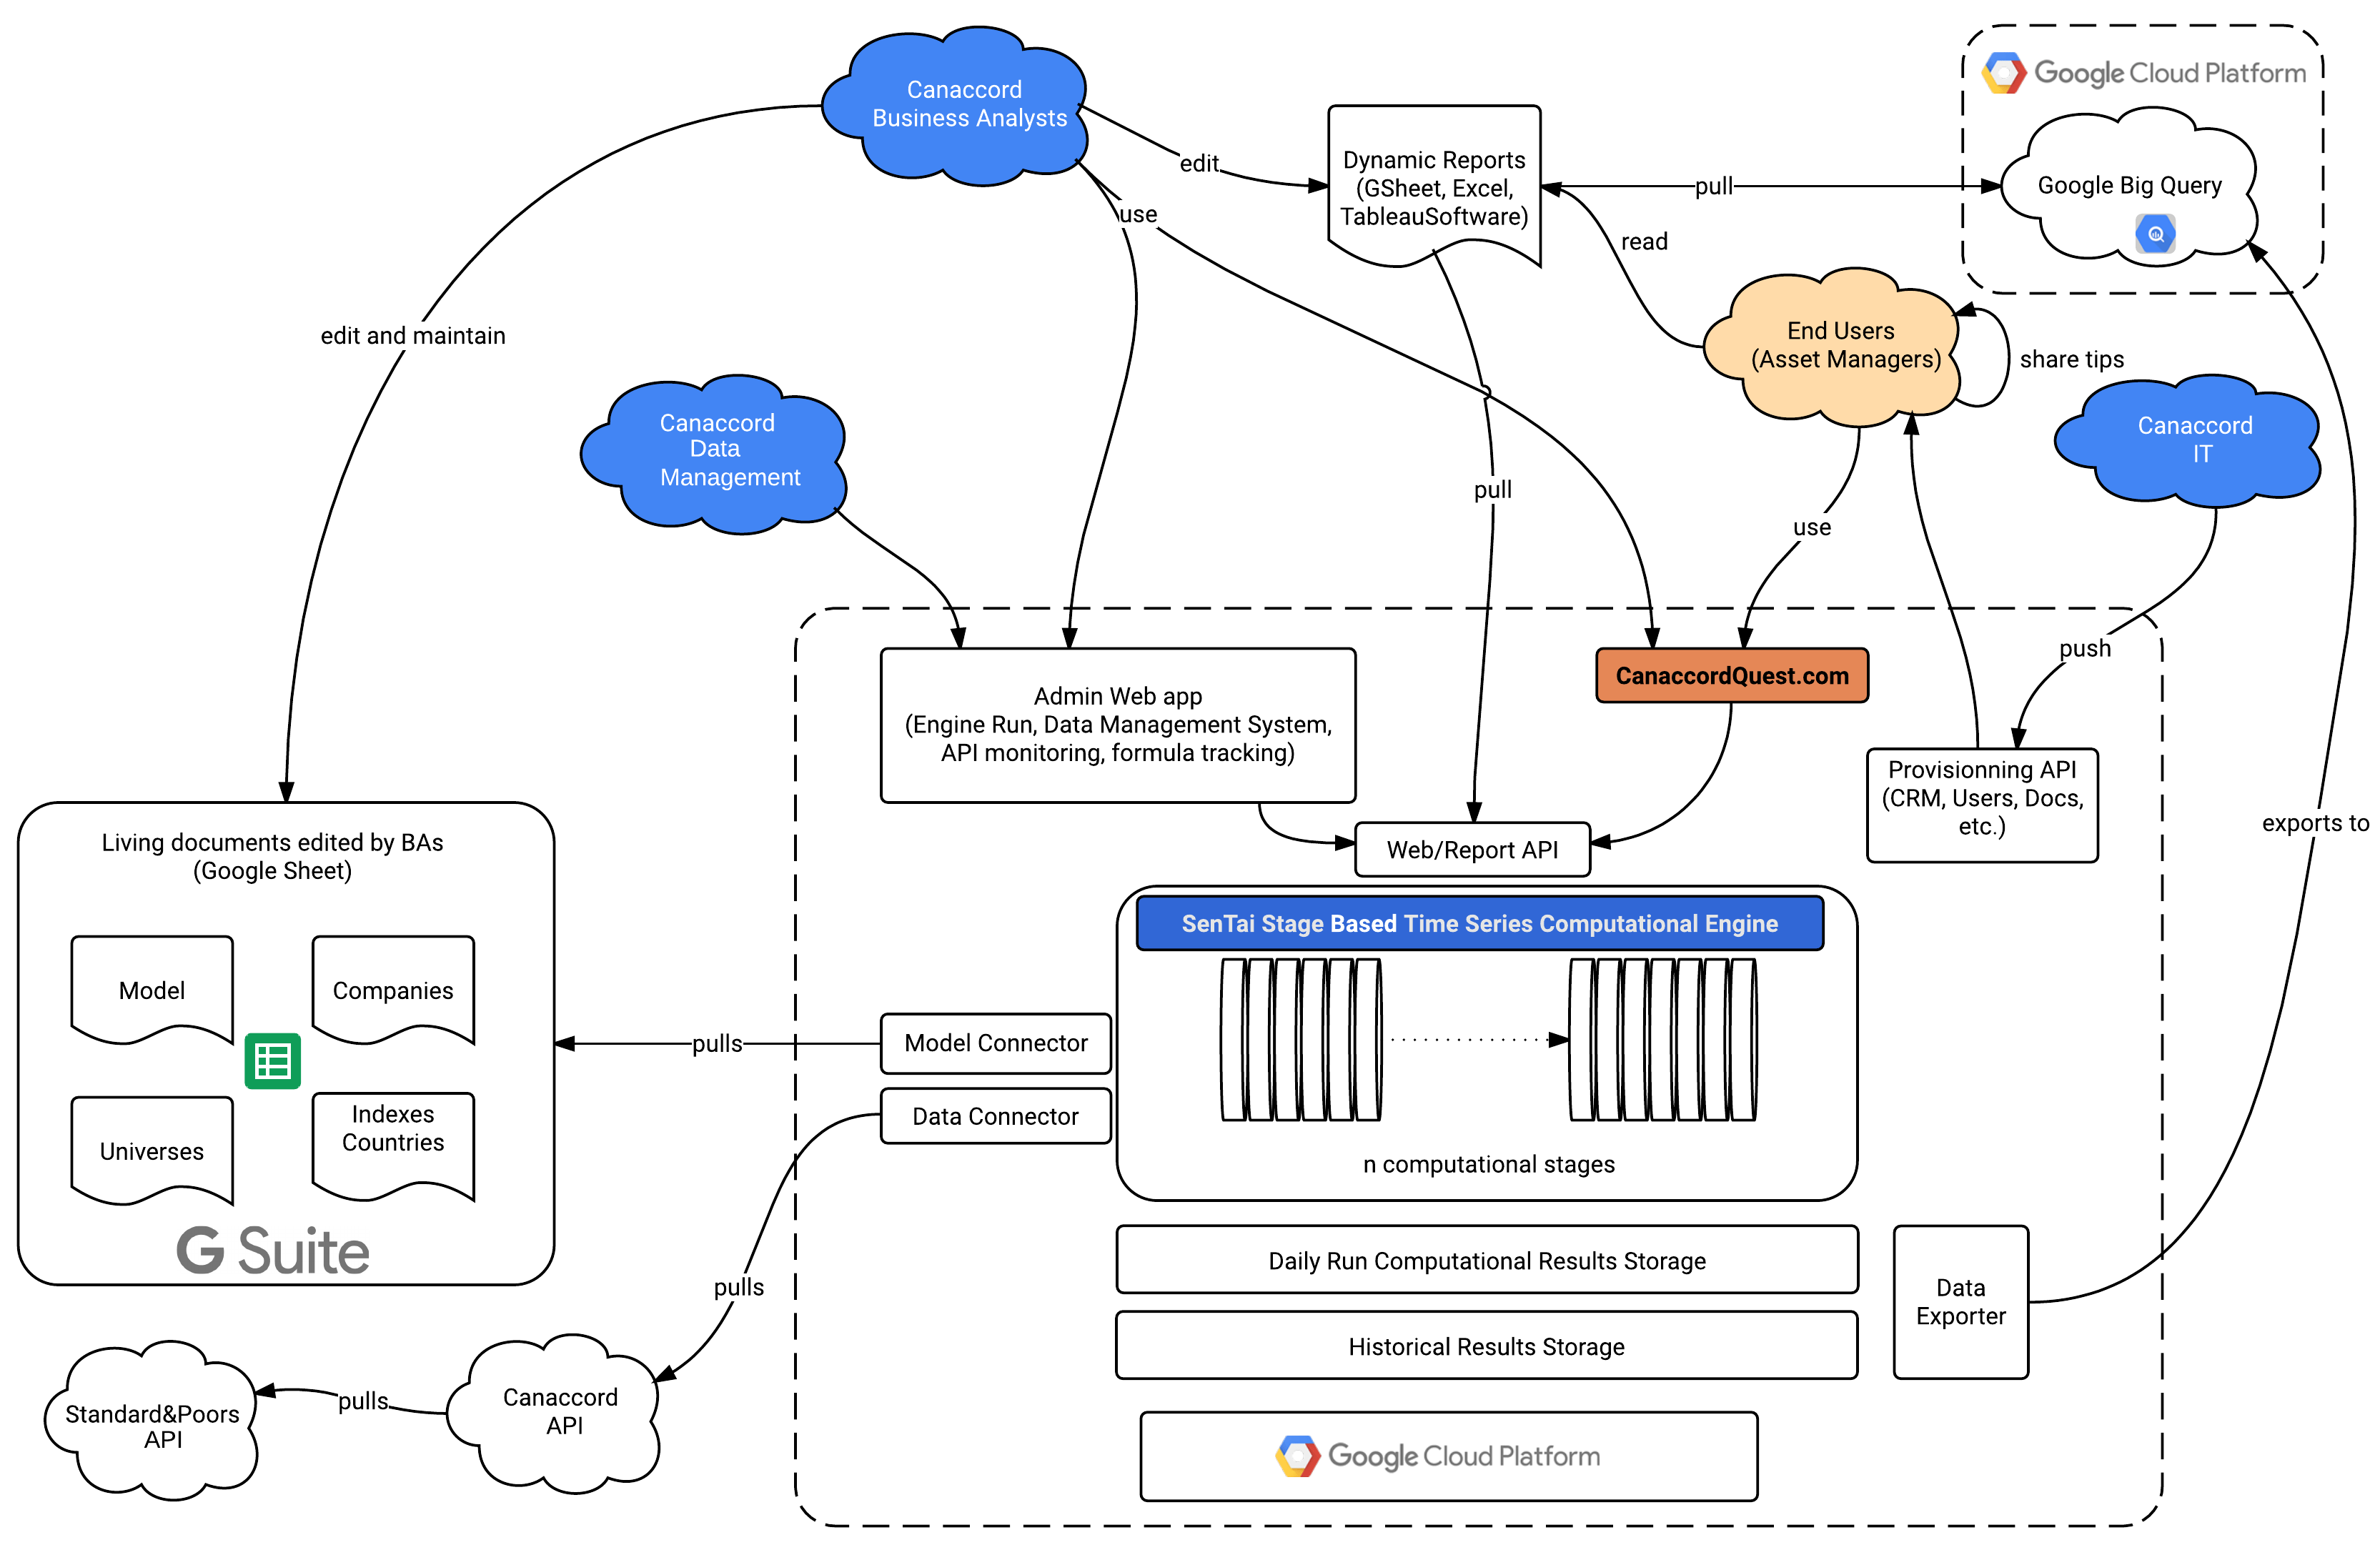
The application is based on a production cycle involving:
- Core Valuation Model: a core tree-like computational model represented in a vast Google Sheet with 80+ stages both at the company level as well as the Aggregate level (Industry & Geographical region).
- Data Import: Raw Financial Accounting Data from S&P
- Data Integrity, validation, correction, filling, restatements and approximations
- Google Sheets: expression of the 7000+ business rules in custom languages and rules used by a team of 10+ business analysts working on the same model (possibly simultaneously).
- Engine: A Java engine parsing the model rules from Google Sheet and dynamically compiling to raw bytecode for maximum performance
- Data Storage Optimization: for multi-dimensional data storage and high performance access.
- Web: 300+ dashboards, charts and dynamic searching within the billions of results done with AngularJS and CoffeeScript.
- Dynamic Google Sheet: dynamic representation of pre and post calculation data using our API.
Each one of these components had to be optimized both on the software side, as well as on the infrastructure side, taking into account the various stages and their requirements in terms of RAM, CPU and Storage. The ease of deployment and dynamic rescaling of these cloud ready options made the management of the web application extremely agile.
Collaborative Challenge
The core model was (re)written by a team of 10+ business and financial analysts, based on a proprietary syntax we developed, and reviewed and augmented by our team of developers, on a very large collaborative Google Sheet. The ability to work collaboratively on this Google Sheet was key to the success of this project, allowing both the business and developer sides to communicate, review, share, and improve the model in a highly agile way.
Fore more details, please see G Suite and Quest.
Remote and Online Collaboration
Remotely working developers in various parts of France, graphic designers in London, together with Canaccord’s Business analysts and IT teams collaborating via Google Hangout, was the key element making the flow of information and exchange of ideas possible. Screen sharing via Google Hangout helped resolve misunderstandings much faster than any chain of mails. Fast chats for shorter conversations.
The complexity of the model was extremely challenging: 7000+ rules using non trivial mathematical / numerical procedures, and complex business rules. Business analysts were held back by the difficulty in expressing correctly their needs in terms of the business model (logic). Interaction within this model using comments in the Google Sheet proved to be perfectly adapted to the needs of a continuous Q&A resolution cycle. Just like a developer bug tracking software.
The fact that we could share remarks via the comment feature of Google Sheet was also key: building a conventional backend application to support the input of such a model would have been way too costly. Worse, it would have diverted our focus to technicalities, rather than the creation of business value.
Our usage of Google Sheet helped us focus solely on a flowing and flawless implementation of business rules.
A critical component of building such a complex model is the validation process: being able to connect Google Sheets to our backend API, and easily show clear graphs and tables to the Business Analyst (BA) team, helped us efficiently discover errors and discrepancies.
Technical benefits
Persistent Storage and Application Performance
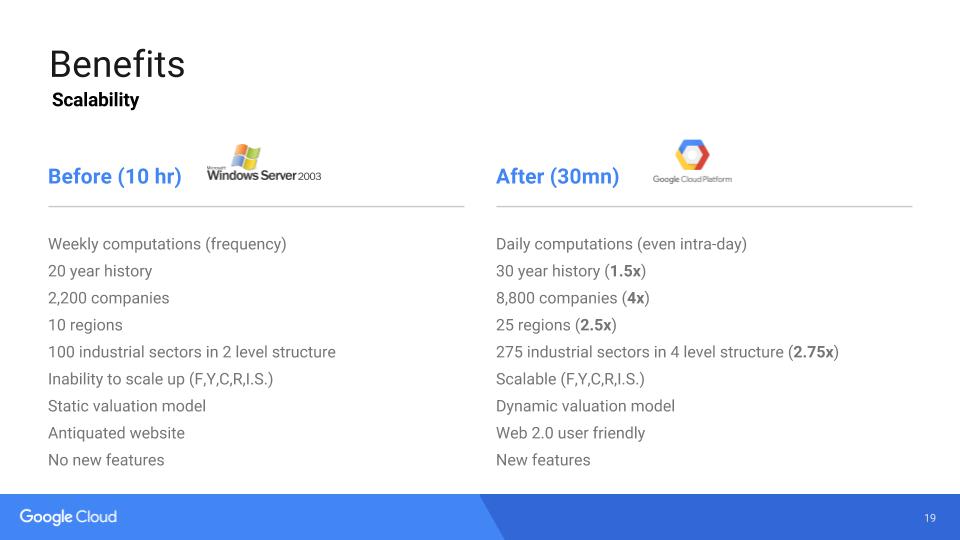
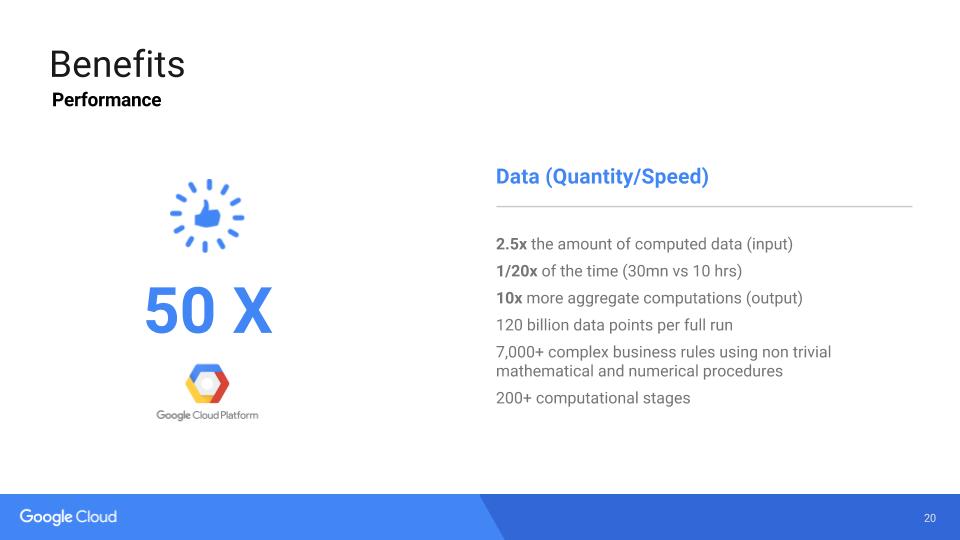
We have extensive needs for SSD persistent storage during the computational phase to optimize the performance of the application. Thus the ability to gradually ramp up the SSD persistent storage to 4Tb per machine has proven key to reduce our overnight app run time by a factor of 2.5. What once required 10 hours+ for significantly less data, we can now compute in the new platform in less than 30 minutes (see Perfomance & Scalibility Gains for more details). The time increase not being linearly proportional to the number of companies, we hope to be able to compute up to 50K companies overnight, on a single 32 core CPU VM instance with 200+GB RAM.
Perfomance & Scalability Gains
In the legacy system, a full VE Run took 10 hours to manage 2,200+ companies, way fewer industrial sectors (only the first two MSCI Industrial sector levels), as well as a limited number of geographical regions (10). In the new system, we are running 8,800+ companies, the full 275 MSCI industrial sector classification, as well as 25 different geographical areas. Finally the model accommodates for a much greater number of company and aggregate metrics. All done in under 30 minutes. The performance and scalability gains are staggering, at more than 50x.
Price Competitivity & Benefits
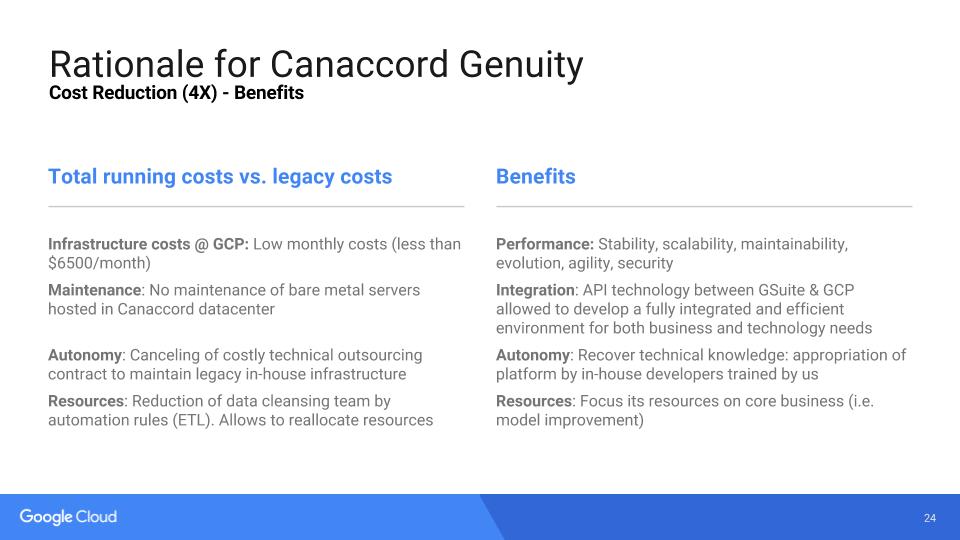
Significant cost savings have been made thanks to:
- An extremely agile development process
- A very low cost of commoditized elastic computing cloud infrastructure
- A very stable platform with low maintenance cost
Cloud Savings
Frequent price drops and most competitive offering are driving the whole industry. Commoditization is driven by Google’s know-how, and benefits the end users such as Canaccord. We’ve been able to start small, and scale up only when ready. The benefits compared with previous hosting providers is substantial. Canaccord was used to in-house infrastructure, with a very slow pace of change: they were amazed at the speed at which we could create/delete/update instances to meet our requirements. The affordability of both GCP and GA4B made them the right combination for the dev team, as well as the business team.
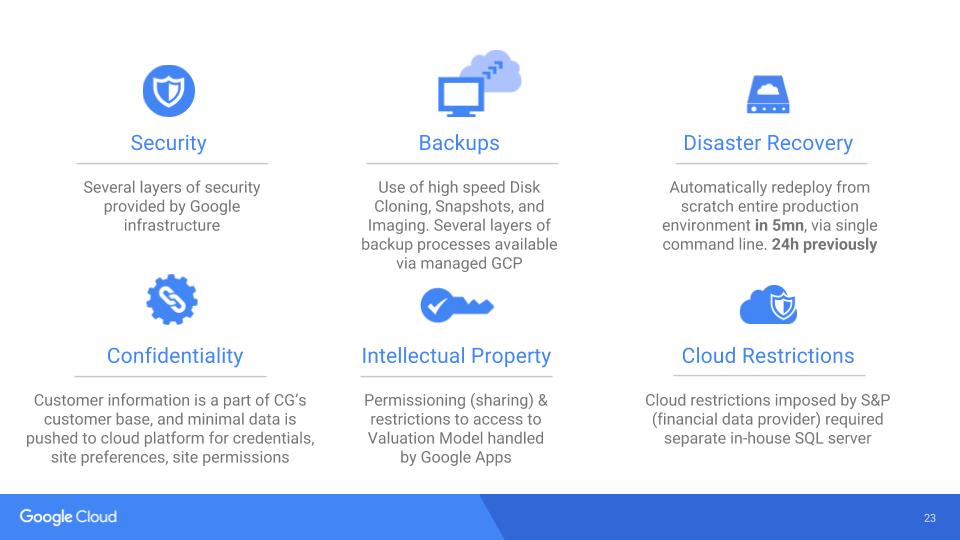
Risk Mitigation
Training and Handover
Through the entire development process, we have accompanied the business analysts very closely to help them master the new valuation methodology, enabling them to master the novel Time-Series base language we developed. Additionally, we also started training the internal IT team @ Canaccord to prepare them with the handover of the platform. Training in-house Open Source developers is a key to the log-term success large cloud computing and web platforms.
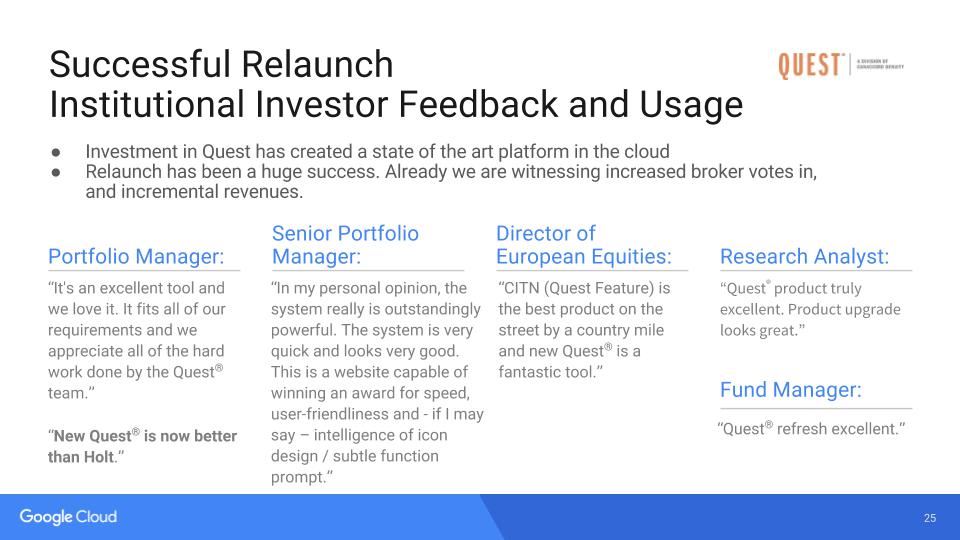
Success
Customer Feedback
IT Feedback